Nash Equilibrium: Why Stable Doesn't Always Mean Good
What is a Nash equilibrium? Two coffee chains choosing where to open show how rival responses, multiple equilibria and real limits shape stock analysis.
Mục lục
Two coffee chains are about to open a new shop. The city has two suitable districts: the North has more customers, the South has fewer. If both pick the North, they split the crowd. If each takes a different district, both can earn more. You are looking at the stock of one of these chains. Is its expansion plan attractive?
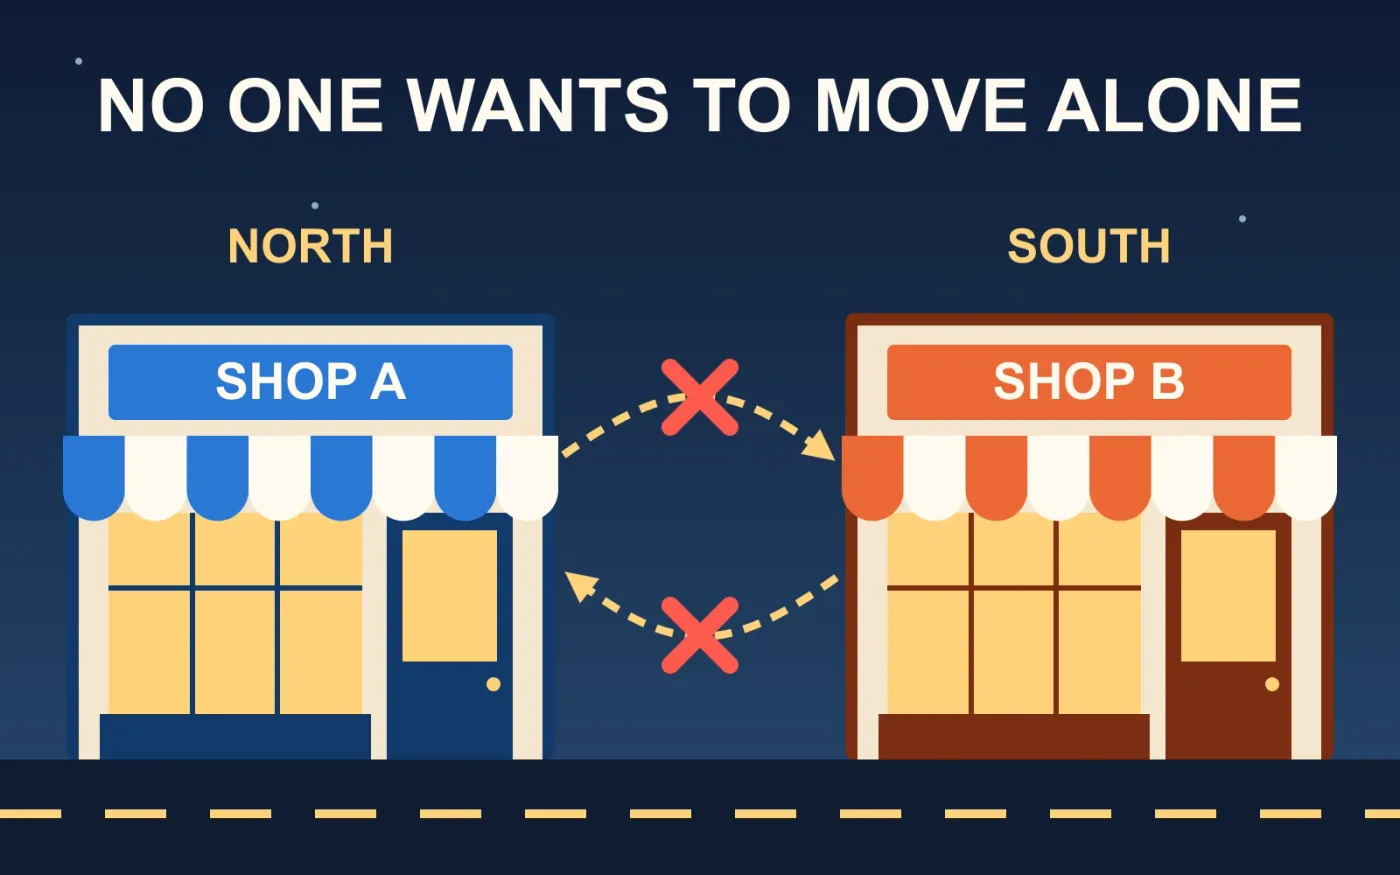
A Nash equilibrium is a set of choices in which nobody gains by changing their own choice while everyone else stays put. Picture two shops that have each found a spot, where moving alone would only hurt. That does not make the outcome the best one, the fairest one, or a permanent one. For an investor, the concept adds one question: does the company’s plan still work once you count how rivals will respond?
Why can’t you judge one company’s plan alone?
A new shop may be profitable standing by itself. Put a rival right next door and the arithmetic changes. Adding new customers and taking customers from someone else are not the same source of growth.
This is strategic interaction: your result depends on what other people choose as well. At lunchtime, a quiet restaurant is a good pick, but if the whole office picks it, you end up in a queue. The best choice is not fixed to one address.
Game theory studies situations like this. The word “game” does not mean entertainment. The players can be companies, workers or regulators. The press release for the 1994 economics prize names competition among a few firms as one application of this kind of analysis.[1]
A report on a chain’s expansion usually gives you the number of new stores and the expected revenue. The harder part is asking what rivals will do. Will they open nearby, cut prices, improve the product, or leave that area and focus elsewhere? A plan that only works if competitors stand still is a plan that needs more checking.
Two districts, four outcomes
Let’s make the story precise with a small table. Companies A and B must each choose North or South before they know the other’s decision. Each opens exactly one shop. Waiting or opening a second location is not allowed.
The table shows illustrative payoff points, not billions of dong or percentage returns. The first number belongs to A, the second to B. A higher score means an outcome that company prefers. We assume both companies value outcomes the same way and both know this table.
| A chooses / B chooses | North | South |
|---|---|---|
| North | 2; 2 | 6; 5 |
| South | 5; 6 | 1; 1 |
If both enter the North, each gets 2 points because they compete head to head. If both enter the South, each gets only 1 point because the market is smaller. Alone, the North brings 6 points and the South brings 5.
These numbers were chosen to show the mechanism clearly. They do not claim that every coffee chain has this profit structure. Two shops standing close together might both attract more customers instead of just splitting them. In that case you change the table, you do not force reality into the example.
Put your finger on each cell to find the equilibrium
Start with the cell where both choose North, worth 2; 2. If B stays, A can move to the South and go from 2 to 5. So this is not a Nash equilibrium. Finding one player who gains by moving alone is enough to rule out a cell.
Now take A in the North and B in the South, worth 6; 5. If A moves alone to the South, A drops to 1. If B moves alone to the North, B drops to 2. Neither gains by moving alone. This is a Nash equilibrium.
Swap the roles, with A in the South and B in the North, and you get another equilibrium. If both are in the South, one side can move to the North alone and go from 1 to 6. That cell is not an equilibrium.
We have found two equilibria with fixed choices. That is already enough to reject a common misunderstanding: knowing the table does not necessarily tell you the one thing that will happen. You need more information to know which company goes where.
“Best” always comes with “given what the other side does”
In this example, A has no district that is always better. If B is in the North, A should be in the South. If B is in the South, A should be in the North.
That is a best response: the choice with the highest payoff once the other players’ choices are held fixed. It is like picking a supermarket checkout line after looking at the other lines, rather than trusting that counter 3 is always the fastest.
A Nash equilibrium appears when best responses fit together. A does not want to change because of what B is doing. B does not want to change because of what A is doing. The concept describes this fit. It does not award a medal to the outcome.
A different concept is the dominant strategy: a choice at least as good as the alternative in every situation the rival can create. If it is strictly better in every case, we call it strictly dominant. In some other imagined table, a location that is both cheaper and sells better wherever the rival stands could be a dominant choice.
The two-district table has no dominant choice, yet it still has Nash equilibria. “Nobody has an always-winning move” and “there is no equilibrium” are two different statements.
Is an equilibrium good for everyone?
The two cells where the companies split the districts both total 11 points, more than the other two cells. But that is a feature of the table we happened to choose, not a required property of a Nash equilibrium.
In the prisoner’s dilemma, two sides can each settle on an action they want to keep as long as the other does not change. Yet if both switched to the other action together, both would be better off.[2] Think of two restaurants both playing loud music to draw in customers: neither wants to turn it down alone, even though the whole street might be more pleasant if both did.
An outcome is called Pareto efficient if you cannot make one person better off without making someone else worse off. Picture sharing a cake: while some cake is left uncut, you can give someone more without taking from anyone else. Only when no such improvement remains does the outcome meet this condition.
The Nash condition asks about one person changing alone. The Pareto condition compares outcomes, which may require several people to change together. The two tests do not answer the same question. An outcome can also be Pareto efficient and very lopsided; “efficient” here does not mean fair.
With stocks, you also need to look at people who are not in the table. Two companies raising their profits does not mean consumers gain. If there is an agreement that restricts competition, the legal question differs from the mathematical one. The Nobel press release also notes that contracts restricting competition can be illegal.[1]
Why can two companies both reason correctly and still collide?
Suppose A and B both think: “The North is better, the rival will give way.” Both enter the North and earn only 2 points. They did not add up the numbers wrongly. They guessed each other’s choice wrongly.
A Nash equilibrium is a consistency condition. It does not supply the process that leads to that condition. You need to know what the companies can observe, when they commit, and how they can revise a decision. Two companies signing leases one after the other are in a different situation from two companies choosing at the same time in secret.
Even adjusting together may not lead to an equilibrium. If both are in the North, both see that the South is better, and both move, they collide in the South. If both move back, the cycle repeats. This is a path you can construct from the table, not a forecast of how real companies behave.
An announcement of a new store is not necessarily a commitment that is hard to reverse either. Signed contracts, money already spent and rights to cancel all change what a company can do next. In practice, the timing and credibility of an action matter as much as the numbers in the table. Reinhard Selten’s analysis of whether threats are credible is one extension explained in the Nobel source.[1]
What if the rival has not decided yet?
Now A does not know where B will go. A believes the probability that B picks the North is . This is a belief inside the model, not a probability measured from a stock price.
In the formulas, and stand for North and South. If A picks the North, A gets 2 points when meeting the rival and 6 points when alone. Expected payoff is an average weighted by probability, like working out your average lunch bill when some days you pay 30,000 dong and some days 50,000. From the table:
If A picks the South:
When is low, the North is better. When is high, the South is better. The two choices are equal at , which gives , or 62.5%.
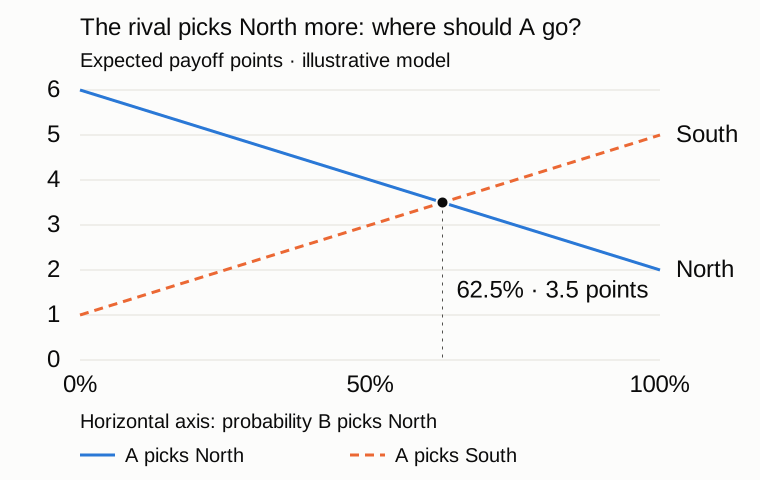
| Probability B picks North | A picks North | A picks South |
|---|---|---|
| 0% | 6 | 1 |
| 25% | 5 | 2 |
| 62.5% | 3.5 | 3.5 |
| 100% | 2 | 5 |
A mixed equilibrium is not putting 62.5% of your capital in a stock
A mixed strategy means choosing randomly between actions with set probabilities. It is like using some random method to pick rock, paper or scissors before each round, instead of always playing rock. This is a probability distribution over actions, not buying that share of a shop.
In this symmetric table, if both pick the North with probability 62.5%, each side leaves the other indifferent between North and South. Changing your own mix does not raise your expected payoff while the rival’s mix stays the same. That is one more equilibrium, a mixed one. Each side expects 3.5 points.
Nash’s existence result says that a game with finitely many players and finitely many actions has at least one equilibrium once mixed strategies are allowed.[1] It does not guarantee an equilibrium using only fixed choices, and it does not guarantee a single equilibrium.
The theorem does not say every market will soon settle down. In real markets, players enter and leave, products change, information is missing and goals differ. A theorem that is true inside a model has to be carried outside along with its conditions.
Taking the Nash question into company analysis
When you assess a company’s expansion, the first question is not “which formula finds the equilibrium?” First work out who can really respond. A small shop among thousands of cafes is a different case from two big chains fighting over a few prime locations.
Next, look at which options the company has and which costs are hard to recover. If a factory is finished before the company learns that its rival has also added capacity, it cannot simply go back to not having invested. A table with only “open” and “do not open” may miss scaling down, delaying or changing the product.
Last is what the company is actually optimizing. This year’s profit, market share and the cash flow needed to repay debt can lead to different actions. A cash-strapped company may be unable to wait for a good long-term outcome. An investor should not assume that every player keeps score the same way.
You can write down three parallel scenarios: the rival does not respond, responds moderately, and responds strongly. This is a way of asking questions about revenue, costs and margins. It does not turn those assumptions into reliable probabilities. To turn such scenarios into a price you still need a valuation technique, as in Asset valuation techniques. The article on regression to the mean (article in Vietnamese) points to another limit: a good result or ranking over one period is not enough to prove a lasting advantage.
Nor can you look at one wave of stock selling and conclude that the market just “left a Nash equilibrium”. We do not know enough about the players, their options or their payoffs. Seeing two sides act together is only an observation; explaining their motives needs more evidence. If you worry about conclusions drawn from the few cases that remain visible, the article on survivorship bias (article in Vietnamese) adds a way to check the sample you are looking at.
Plot the best responses yourself
The Python below uses only the standard library. It computes the two lines from the payoff table, solves for the crossing point and saves the SVG figure into the article’s image folder. There is no downloaded data and no randomness, so running it again gives the same result.
Run it from the root of eyeblogs/. Try changing the payoffs and recomputing the crossing point: you will see that the 62.5% threshold belongs to this particular table, not a constant of competition.
from pathlib import Path
# A's payoffs: rows are North/South, columns are B's choice of North/South.payoff = ((2, 6), (5, 1))a, b = payoff[0]c, d = payoff[1]q = (b - d) / (b - a + c - d)u = b + (a - b) * qx = lambda p: 80 + 580 * py = lambda value: 360 - 45 * valuesvg = [    '<svg xmlns="http://www.w3.org/2000/svg" width="760" height="480" viewBox="0 0 760 480">',    '<rect width="760" height="480" fill="#fcfcfb"/>',    '<g font-family="Arial, sans-serif" font-size="24" fill="#0b0b0b">',    '<text x="80" y="35">The rival picks North more: where should A go?</text>',    '<text x="80" y="67" font-size="20">Expected payoff points · illustrative model</text>',]for value in range(7):    svg += [f'<path d="M80 {y(value)} H660" stroke="#e1e0d9"/>',            f'<text x="60" y="{y(value)+7}" text-anchor="end">{value}</text>']for p, label in [(0, "0%"), (0.5, "50%"), (1, "100%")]:    svg.append(f'<text x="{x(p)}" y="392" text-anchor="middle">{label}</text>')for row, color, dash in [(payoff[0], "#2a78d6", ""),                         (payoff[1], "#eb6834", ' stroke-dasharray="9 6"')]:    left, right = row[1], row[0]    svg.append(f'<path d="M{x(0)} {y(left)} L{x(1)} {y(right)}" '               f'fill="none" stroke="{color}" stroke-width="3"{dash}/>')svg += [    f'<path d="M{x(q)} {y(u)} V360" stroke="#52514e" stroke-dasharray="3 5"/>',    f'<circle cx="{x(q)}" cy="{y(u)}" r="6" fill="#0b0b0b" stroke="#fcfcfb" stroke-width="2"/>',    f'<text x="{x(q)+14}" y="{y(u)+95}">62.5% · 3.5 points</text>',    '<text x="676" y="277">North</text><text x="676" y="142">South</text>',    '<text x="80" y="428" font-size="20">Horizontal axis: probability B picks North</text>',    '<path d="M80 455 H115" stroke="#2a78d6" stroke-width="3"/>',    '<text x="125" y="462" font-size="20">A picks North</text>',    '<path d="M350 455 H385" stroke="#eb6834" stroke-width="3" stroke-dasharray="9 6"/>',    '<text x="395" y="462" font-size="20">A picks South</text></g></svg>',]out = Path("images/can-bang-nash/phan-ung-tot-nhat-en.svg")out.parent.mkdir(parents=True, exist_ok=True)out.write_text("\n".join(svg), encoding="utf-8")print(f"q = {q:.3f}; payoff = {u:.1f}; figure: {out}")
The code prints q = 0.625; payoff = 3.5. When you change the table, also change the axis limits and labels if the new values fall outside the figure. This code reproduces the example; it is not a general solver for every game.
Back to the two shops about to open
If you read only A’s plan, the North looks like the best place. Read B’s plan too, and the question becomes who will go where and how each side can respond. A good location is not necessarily a good decision when someone else is aiming for it too.
A Nash equilibrium helps us find the sets of choices where nobody has a reason to change alone, under the assumptions stated. It does not promise to pick the winning company. What is worth keeping when you read an investment project is the half of the sentence that often gets forgotten: best, given what everyone else does?
Free geometry illustrations for students and teachers: EyeViz.
Tài liệu tham khảo
- [1]The Sveriges Riksbank Prize in Economic Sciences in Memory of Alfred Nobel 1994: Press release. NobelPrize.org, Royal Swedish Academy of Sciences, 1994.
- [2]Prisoner’s Dilemma. Stanford Encyclopedia of Philosophy.